


What would you do with more time?
Imagine that you finish work an hour early today. Done — no lingering tasks. Will you cook supper instead of grabbing fast food? Take the dogs for a walk? Go to bed early?
Extra time is precious. It’s a gift that Raven strives to give busy marketers every day.
That’s why our automated marketing reports have long been one of our most popular features. As one agency customer wrote, “It’s simple to set up, white label and automate Raven reports so that we can focus on our client work.” Another customer said that her team produces monthly reports 40% faster with Raven.
When we set out to build the next generation of Raven reports, we knew they had to be even faster to create, with exactly the metrics that matter to you. They needed to be easy to read and understand, anywhere — online, interactive and mobile friendly. And they needed to impress the hell out of your clients.
Our product designers and developers rose to the challenge. They built more than a new reporting tool. They built a new reporting engine. It uses new code, new logic, new charts, new everything.
Today, Raven releases that reporting engine. It powers a new Dashboard tool (surprise!), as well as the new Reports tool you’ve been hearing about. For those looking to have a full-on use case walkthrough, we’ve created a great post that covers how marketers should build their SEO Reports.
Exploring the New Reports
Let’s take a closer look at the main features.
1. Custom
Raven’s existing Report Wizard was beloved, but it had its limitations. Marketers couldn’t control how their metrics looked, nor could they see exactly what they were reporting until they downloaded a PDF. The new Reports tool is WYSIWYG — pick a metric, choose its format and see exactly what your clients will, immediately.
Most metrics are available in at least two of these formats:
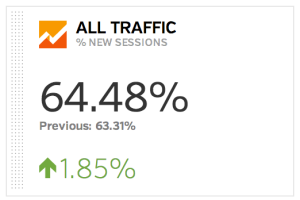
KPIs:
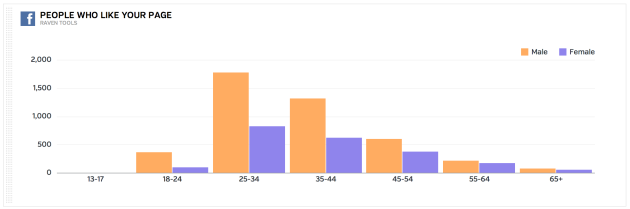
Bar charts:
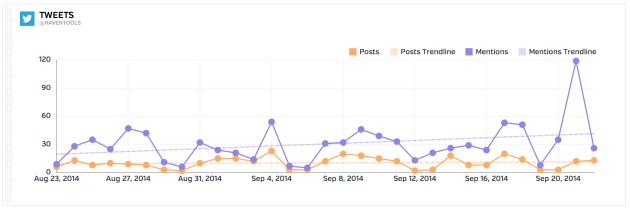
Line graphs:
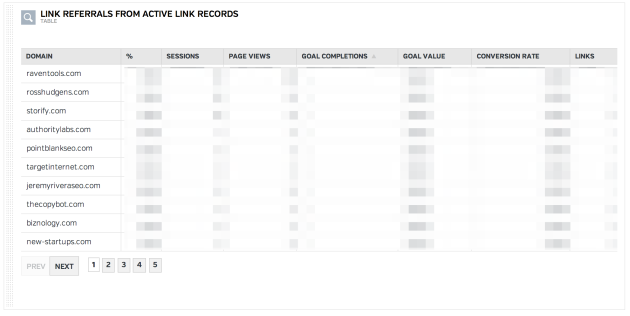
Tables:
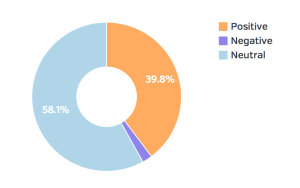
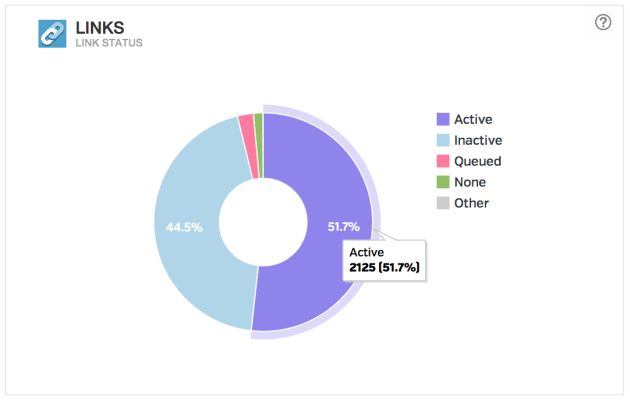
Pie charts:
We’ll add more options and flexibility to more metrics in the coming weeks.
When you create a report, you can choose from preexisting groups of metrics, called widget groups, from a variety of data sources.
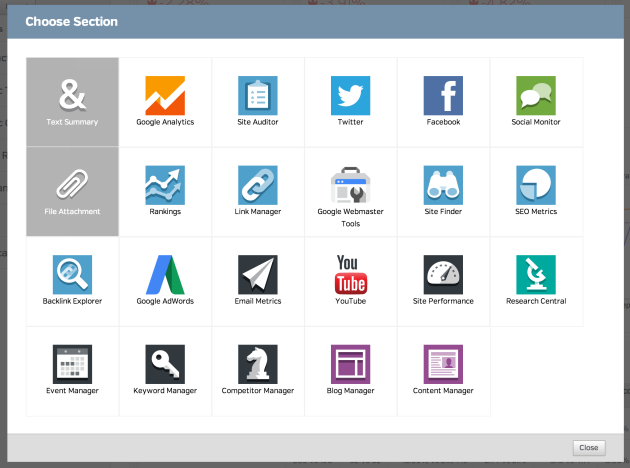
Want to get a fast baseline report for a new campaign? Create a new report and choose a handful of widget groups. Instantly, you have an overview to kick off your planning.
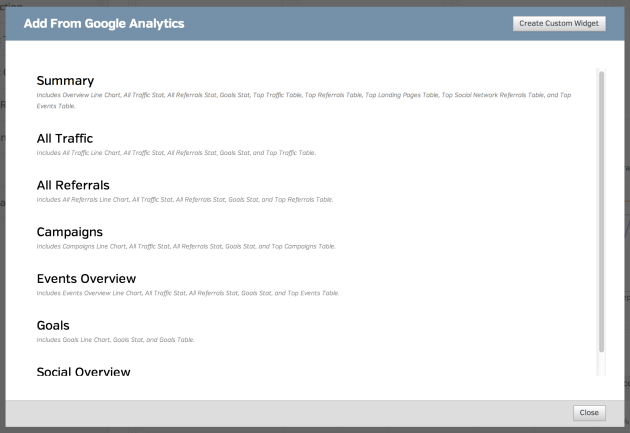
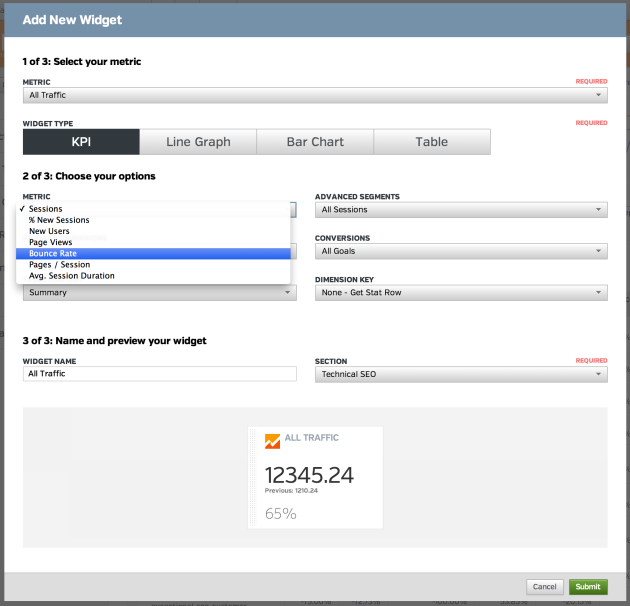
Or you can create an individual custom widget. We’ll use Google Analytics as an example. You can drill down as deeply as you need to show off the effect of your campaigns.
You can rearrange your entire report with a simple drag-and-drop of the sections. And you can rearrange the widgets within an individual section of your report.
2. Interactive
Raven’s new reports output to a single HTML page, not a bulky PDF. Simply send your clients the link (or automate that process with Raven)! Whether they’re on a desktop or laptop computer or a mobile device, clients can quickly click between sections of your report. They can sort columns in tables or hover for more information on graphs and charts.
Right now, you’ll find a Print Friendly button on the HTML page. Our goal is to create exports to multiple formats, including PDF and PowerPoint.
If you’re a current Raven customer, you might be wondering about your existing PDF reports. We’re building a simple conversion tool for moving existing PDF reports to the new format. We want to release that by the end of the fall. And you can access the existing Report Wizard — with all of your automated PDF reports going out on schedule — at least through early next year.
3. Beautiful
When many online marketers are still using Excel to create client reports, beautiful may sound like a stretch. The truth is, your clients may never see 98% of the work you do for them — but they will see all of the reports you send them. It’s important to make a great impression. Our UI designer worked hard to create a sophisticated style that will keep your agency looking professional and up-to-date.
You can embed Twitter and Facebook posts right into your reports to highlight big social media marketing wins. They look great, and your clients can click through to the original posts.
Oh, and for those times when your report needs a touch of whimsy, see what happens when you upload an animated GIF as your logo.
We’re already planning to make visual improvements, including these:
- Multiple color schemes from which you can choose
- More and better looking widgets, such as those for Site Auditor data
What else do you recommend?
Exploring the New Dashboards
If you can create one of the new reports, you can create one of the new dashboards, and vice versa. They’re identical in format, but there are important differences:
- Each campaign has one dashboard.
- Dashboards are unique to each Raven user.
- Dashboards cannot be shared externally.
- Dashboards refresh automatically, on a daily basis at the very least.
This way, each marketer using Raven can create a rolling, internal view of how each of their campaigns are performing, whereas reports are snapshots of a fixed time period to share with clients.
How To Access the New Reports and Dashboards
If you’re a current paying customer, a current trial customer or a customer whose trial has expired within the past 30 days, here’s where to find the new tools:
- Log in to your account. You may see a notice pop up about the new tools.
- Go to any Profile and Campaign, but preferably one with a lot of data!
- Go to Campaign > Dashboards NEW. Start customizing your personal dashboard.
- Go to Reports > Reports NEW. Start creating reports.
If you’re brand new to Raven, sign up for a free, 14-day trial. There’s no credit card required now, and no contracts later on. When you create your account, be sure to add multiple data sources, such as Google Analytics, Facebook or Twitter. You can start creating a Dashboard and Reports right away, but without data, there won’t be much to see!
How To Get Help
1. Training Classes Start Tomorrow
Raven’s co-founder Jon Henshaw will be teaching several live, 30-minute classes online over the next several days. Sign up for the course that’s most relevant to you:
- Existing customers, especially those wondering about the transition from the Report Wizard to the new Reports
- New and trial customers, or folks who just want to learn more
2. Get 24/7 Answers at the Help Desk
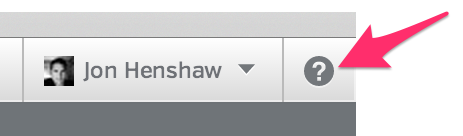
Recently we replaced Raven’s clunky Knowledge Base with a streamlined Help Desk. Our how-to and troubleshooting articles are now shorter, simpler to read and easier to understand. Many feature quick videos to help you visually. Bookmark the Help Desk to go to it directly, or click on the ? icon next to your name to search it from within Raven.
Be sure to check out the New Reports and Transitioning to New Reports sections, which contain guides and FAQs that’s we’ll be updating frequently.
If your question isn’t answered in a Help Desk article, email us at help@raventools.com.
3. Keep Up with Bug Fixes and New Features
We expect to make quite a few bug fixes and improvements to the reporting engine in the near and far future. Keep up with what’s new — small and big — on our Software Updates page.

White Labeled and Branded Reports. Drag and Drop Editor. Automate your SEO, PPC, Social, Email, and Call Tracking Reporting.
This looks amazing, I’m so excited to learn more! Does the “text summary” feature work similar to the way narrations work with Measureful reporting software? I really hope so!
Sean, could you describe that or share a screenshot? We would love to see it.
This is great news! I’m excited to see how this evolves.
So are we — so many ideas and plans already!
I played with this about a month ago, so I’m sure I need to catch up some, but at that time you had to go and set up this individually for each client. There wasn’t a template that I could find at that time. Has this changed or is it in the works? It would be VERY helpful and save a lot of time.
Thanks for doing what you do!
Kevin, yes! I remember your feedback, and we made sure we didn’t launch this until we made that process easy. Here are step-by-step instructions: https://raven.zendesk.com/hc/en-us/articles/203231670-How-do-templates-work-with-new-reports-
I should have known… You can’t turn off your awesome switch!
Thanks!
It’s true 😉
Of course not 😉
Killer! So glad to see this rolling out live. Looking forward to this becoming a Powerpoint output too!
Fired up and excited to give it a test ride!
It is here! Just saw the layout of the new report builder. Very clean, I am excited to play.
Love this, have been waiting for these for ages since Jon first mentioned new reports were coming. Quick question, as an agency that also works in PR is there any way for us to drop articles and coverage into these new reports? Either as a screenshot image or better still as a weblink preview ala Storify?
Screenshots, no, and not weblink previews yet, either. Those are are the list. For now, you can add links with a Summary widget, or you can use the File Attachment widget to create a link. There are corresponding icons based on the file type. Let me know if this makes sense — and be sure to ask for that via help@raventools.com or the ? in the app.
I’ll give those suggestions a try and certainly put in a request for these features. At the moment we use Gorkana to produce our media coverage reports and it’s damn good but it we were able to drop their pdfs or images into your reports I think we’d have a perfect whole campaign reporting system.
Ran into a bit of a bug.
When I attempt to sort a list by “Sessions” in “Descending” order – it lists the items in order based by the percentage changed opposed to the actual number of sessions.
Hope this makes sense!
Jeremy, could you report that as a bug via the ? icon or help@raventools.com, if you haven’t already? I’d like to get that one taken care of as soon as possible.
Hey! Any news on this? It’s proving a problem across all of my tables too 🙁
Frustrating, I know — I’m having the same issue. This is one of our Top 5 fixes, which we’re working on right now. We plan to get this fixed within the next week.
The same for me!
And another thing, every time I open the settings of a section, I lose the previous order of the widgets. It’s a bit daunting…
Hmm… I have heard of this happening in a few cases, but I thought we had resolved most of those. If you haven’t already, could you report exactly what’s happening to help@raventools.com?
Yup, it’s dope! Really happy to see the innovation from a great company.
So far so good, one issue the conv column for Adwords is “text” not a number so 5 is greater than 44 for example.
I believe we have fixed this one already. If you’re still having this problem, please let us know at help@raventools.com.
I registered for the webinar yesterday but I missed it. Is it possible for me to get a recorded webinar for the new reporting engine?
Of course. In fact, here’s a link: http://youtu.be/Ug5GJ1raalw
One thing that held us back from using Raven previously were the dull (sorry) reports – this is much better! We’ll be back to take a look. 🙂
Excellent!
This is a very welcomed addition. However, there are still many customizations in the old reports that are missing. Some of the charts do not work in Firefox and result in an error that says “too much recursion.” The “Print Your Report” button does not work in Safari. In other browsers, there are many overlapping charts. A simple password protection or a get a new link feature would be needed for larger orgs. Don’t get me wrong, I think this is awesome, but it still feels like a beta release.
In IE 11, I just got a new error that says “Out of stack space”
Sam, I appreciate your feedback. The recursion errors are under investigation — that’s a bug we didn’t expect. If you haven’t already, could you report the “Print Your Report” Safari issue, as well as the overlapping charts and stack error? Send the details along to help@raventools.com.
Simple password protection is already on the “very soon upgrade” list.
Finally, what do you mean by “Get a New Link”? I haven’t heard of that idea yet. How would you use it? If you can, send along your idea to help@raventools.com.
Hey y’all — thought you might be interested in reading more about the latest updates: http://blog.raventools.com/new-report-builder-upgrades/
Not bad, however still needs lots of tweaking IMO. Some things I encountered:
Adwords
– Line charts for comparing Adwords metrics (eg clicks vs impressions)
– Selectors for segmenting to specific Adwords campaigns (now it’s 1 campaign or all campaigns)
– Show actual Adwords display ads in stead of headline etc.
– Pie charts for performance of Devices, Networks etc.
– Provide a table widget with Account performance per period (day, week, month)
– Support for Adwords placements
– A way to segment Conversions (eg a KPI-widget) to a specific conversion only. Some Adwords accounts have 5 separate Conversions (eg sales, newsletter subscription contact form), what if I want to report on only one specific of those?
Etc.
SEO
– External backlinks is something you really want to show progress on in a line chart. Not available?
– Same goes for the Site Auditor: there should be a line chart showing progress on the total amount of site issues. Look at Moz.
This seems remarkable, I’m so thrilled to discover a lot more! Thank you for this ideas. More power !
Make your emails more effective with custom email templates designed by our email experts according to the unique needs of your brand.
Hmm I’m a bit dissapointed. Specific for Adwords reporting:
– No comparing metrics in line charts (eg clicks vs impressions)?
– No support for placements?
– No pie charts?
– No wide range of graph choices per metric?
– No reporting on specific conversion types (only all conversions) when selecting the conversion KPI?
– No segmenting on specific utm_campaigns / utm_source etc.?
Please correct me if I’m wrong! For me these are things I use all the time in reporting so…
We really appreciate your feedback, Remko! Our education team received your questions and will be responding soon via email. Please don’t hesitate to reach out if you have any further questions!