nect Google Analytics
At Raven we practically breathe reporting.
Marketers use Raven to craft more than 70,000 reports every month, so we get a huge look at how marketing agencies across the world communicate with their clients. Our customer education team answers thousands of reporting questions. And our internal marketing team uses Raven to analyze and report on the success of their campaigns.
So you might say we know a thing or two about great reports.
There are countless ways to report on a marketing campaign, but the essential ingredients are the same. A good marketing agency report includes:
- Metrics that matter to business goals
- Context for what are good and bad numbers
- Down-to-earth explanations of what’s happening
Here are three marketing agency reports and how to get started with each.
1. Business Development Report
What’s more powerful?
- Sending an email that says “Thanks for chatting with me today. Let me know when you’re ready to talk more about that marketing campaign!”
OR
- Sending a personalized report that details specific areas where a prospect can start making more money.
The answer is obvious.
Rather than sending a lot of lightweight pitches to dozens of prospects, send fewer, laser-focused pitches to your best leads. Framing the initial conversation with a report will give your prospect confidence that you mean business.
Being able to show clients the reports and what they look like before a sale is awesome. Being able to benchmark and show results after the first few months tends to WOW our clients. Christopher West, Digital Marketing Specialist
Worried about time? No need. You’d be surprised how quickly you can crank out a business development report, especially if you’re working from a template.
What To Include
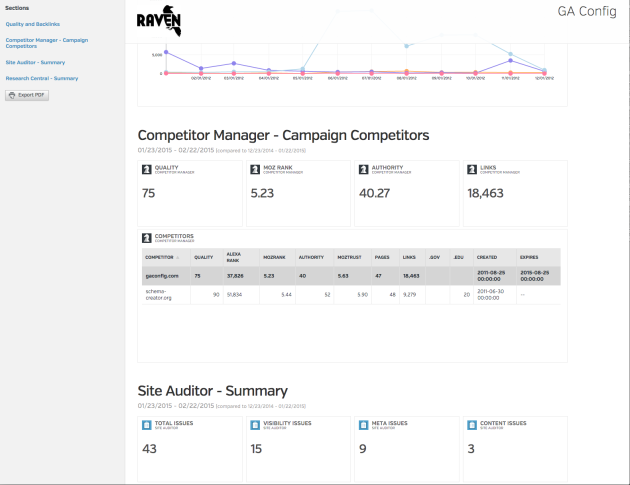
Competitors: Do some quick research on your prospect’s primary website and find some competitors to show them how they’re doing in the pack. This will do wonders at framing your conversation around how your client can be more innovative and successful than their competitors. You’ll be the expert as you start to offer ways to catch up.
Technical SEO: Show room for improvement by including the number of onsite SEO issues that should be cleaned up. Is the prospect’s site too slow? Include research that shows how their slow website is losing money, like this:
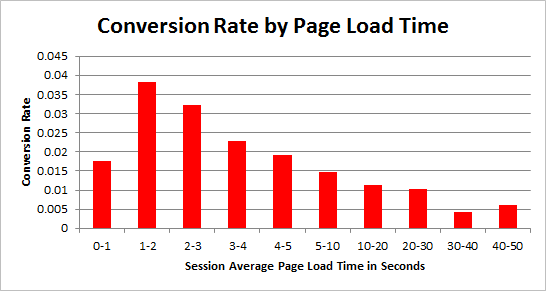
Just a 1-second delay in page load time can cause 7% less customer conversions, according to a 2012 TagMan study.
Backlinks: Show the general health of their website by including backlink data and quality scores assigned to their site by third parties. The number of quality backlinks to a site and how reputable it appears to crawlers are huge factors that impact how often people will find a site online. The beauty of this information is that it’s public and easy to grab, making it easier to build a case for investing in a website.
How To Create a Business Development Report
Prep: Add your prospect’s website as a new campaign in Raven. Then take these steps to quickly, automatically gather the data you’ll need for your business development report.
- In SEO > Site Auditor, click Start Crawling. If you want to include on-site SEO information, wait a day before creating your report to allow for your prospect’s website to be crawled.
- In Research > Research Central, run a search on your prospect’s website. This will retrieve basic website performance data for you. Then, select the Keywords section of Research Central and click on a meaningful keyword related to your prospect’s website. This will start a new query of Research Central based on that keyword. Select the Competitors section. Next to a few competitors, click Gear Icon > Add to Competitor Manager.
Build: In the Report Builder, click New Report. Click Add > Load More to see all options. Add the following groups to your report, as well as Text Summaries to comment on specific opportunities.
- Competitor Manager > Campaign Competitors
- Site Auditor > Summary
- Research Central > Summary
- Research Central > Quality and Backlinks
2. Organic Traffic Report
A meaningful organic traffic report shouldn’t only count the size of an audience. It should go far beyond that to show:
- The steps an audience took towards a marketing goal
- How invested an audience is in your message
- An analysis of what the numbers mean for a marketing strategy
Reporting on your campaign’s impact justifies your budget. Plus, if you follow the data closely, you’ll discover new opportunities you can pursue for your client.
We’re a data-driven agency: we track, test, measure and analyze every piece of information in our clients’ accounts to see what’s working and what’s not. Raven lets us quickly benchmark stats and then rally to move the needle. Guillermo Ortiz, CEO of Geek Powered Studios
What To Include
Goals: One billion new visits mean nothing if they represent people who took one glance at your website and never came back. Quantity is nothing if there isn’t any engagement. Make sure your client’s website is taking full advantage of Google Analytics Goals. With a few snippets of code, you can track the percentage of people who do things like sign up for a newsletter, view a pricing page or use the contact form on your site.
Engagement: You should also report whether your client’s content is continuing to resonate or starting to fall flat. That’s engagement. Measuring bounce rate, pages/session and average session duration gives you a decent picture of engagement for organic traffic, and better ways to measure reader engagement continue to pop up. Start small and simple and build from there once you have a process in place.
Landing pages: If your organic marketing campaign isn’t using landing pages to drive people toward engaging more deeply with your brand, start now.
An average homepage has about 50 links on it. Which means the element you want people to interact with (your form) has approximately a 2% share of the interaction potential of your page (50:1). Compare this to a focused landing page that has only one interaction point—this equates to a 100% share of the interaction potential (1:1). Oli Gardner, Unbounce Co-founder
Because of the vital role landing pages play, be sure to measure which landing pages are performing and which could be improved.
Rankings: Ranking results may have a place in your report, especially as a way to demonstrate the keywords that lead to most engaged traffic or to show the biggest opportunities.
How To Create an Organic Traffic Report
Prep: Add your website as a new campaign in Raven if it’s not already set up. Within your campaign, connect Google Analytics and Google Webmaster Tools to Raven.
Build: In the Report Builder, click New Report. Click Add > Load More to see all options. Add the following groups to your report, as well as Text Summaries to comment on the data.
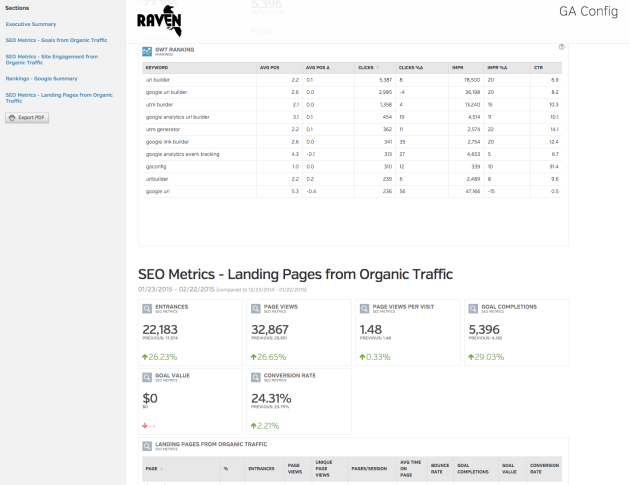
- SEO Metrics > Goals from Organic Traffic
- SEO Metrics > Site Engagement from Organic Traffic
- SEO Metrics > Landing Pages from Organic Traffic
- Rankings > Google Summary
3. Social Media Report
The trick to a great social media report is focus. Don’t include everything because you can. If you can’t explain why a metric is important to a specific business goal, don’t include it.
Make sure you know the primary reasons your client is using social media. Is the goal to…
- Drive traffic to your online properties?
- Turn strangers into people who have heard of you?
- Solve problems your customers are facing?
- Establish your brand as a trusted source of information?
- Sell as many services or goods as you can?
- Interact with as many people as possible?
- Build relationships with influencers?
Once you can answer this question, you can decide which metrics are important to include in your report. Focus on the social media metrics that prove real value, which you can review in this guide:
What To Include
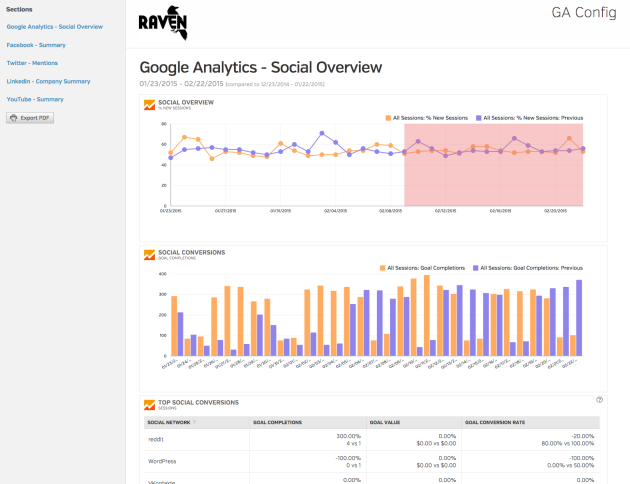
Traffic and engagement: At the least, report on visits to your client’s website driven by each social network, with the corresponding engagement metrics.
Goals: People rarely close the deal on social media, but they do take smaller steps toward becoming customers. So, doing something like measuring how many people sign up for a newsletter via each social network is smart. Use Google Analytics Goals to see which social networks are providing the most qualified leads. Report on the most effective networks and tactics.
We needed a reporting software to monitor our social campaigns and provide our clients with detailed reports. Our social clients know the importance of interacting with the audience and Raven shows them how we’re achieving those goals. Shama Hyder, CEO of The Marketing Zen Group
How To Create a Social Media Report
Prep: Add your website as a new campaign in Raven if it’s not already set up. Within your campaign, connect Google Analytics and any social media accounts you’d like to include in your report. In the Social section of Raven, you can report on Facebook, Twitter, LinkedIn and YouTube data.
Build: In the Report Builder, click New Report. Click Add > Load More to see all options. Add the following groups to your report, as well as Text Summaries to comment on the data.
- Google Analytics > Social Overview
- Facebook > Summary
- Twitter > Mentions
- LinkedIn > Company Summary
- YouTube > Summary
Next Steps
Remember, including metrics that matter is only one of the essential ingredients of a great report. You also need to provide context for the data, plus provide down-to-earth explanations for what’s happening.
Context
Do your graphs and metrics include a comparison date so the report shows change over time? Are important events annotated so clients can see how your efforts or outside forces are impacting the numbers? Are there concepts or research you should link to in your report?
Simplicity
The longer we talk marketing, the harder it is to remember to not use jargon. Try this. Find an 8-year-old. Sit them down and bring a marketing report. Explain the concepts in the report. Keep simplifying your explanations until the child comprehends. Then, use those explanations to rewrite the analysis in your report.
Brevity
The average client is not going to review every word and graph of your marketing report. Make sure the top of the report includes the most important information in bullet point form. And remember, if a graph or table in your report isn’t directly tied to a client’s goal, don’t include it. The more you can shave off, the more powerful your message will be.
Use Templates To Get More Efficient
Once you have an effective marketing report, make sure you can copy the report and use it as a template for future reports.
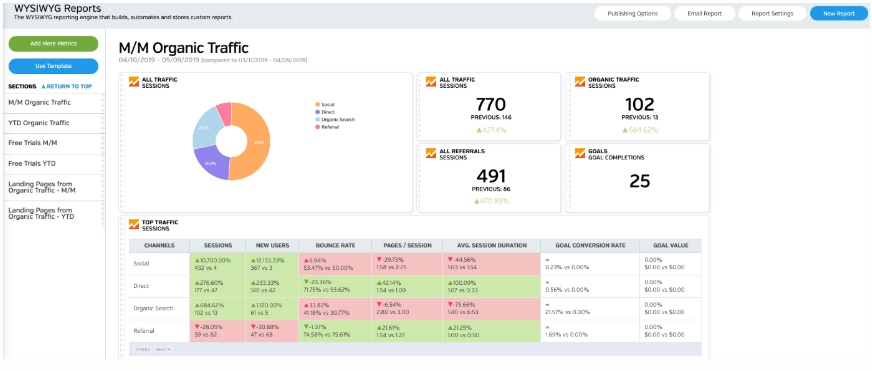
White Labeled and Branded Reports. Drag and Drop Editor. Automate your SEO, PPC, Social, Email, and Call Tracking Reporting.


We like and think one on one engagement is effective!
Absolutely! There’s nothing more powerful than one-on-one communication 🙂
We like and think one on one engagement is effective!
Absolutely! There’s nothing more powerful than one-on-one communication 🙂
Great post. You guys have any other super useful report how-tos like this anywheres? Send me a link of so… your blogs not so easy to get around in. Would love to know some best-use type stuff to make the best reports with Raven Tools
Thanks Kalon!
Glad to help. Here’s a recent post on creating marketing proposals ( http://blog.raventools.com/create-marketing-proposal/ ) and another on creating a minimalist report ( http://blog.raventools.com/minimalist-marketing-report/ ).
Our help desk also covers many common tasks in Report Builder. ( https://raven.zendesk.com/hc/en-us/sections/200597990-Report-Builder-How-Tos ). Then of course if you’re looking for help on how to create a specific report, feel free to email help AT raventools.com anytime and we can help out!
Good