


Here’s a common situation: You’re creating lotsauthorizing your accounts of content. You pour your heart and soul into creating stuff you think your audience will find extremely useful.
So… how is that content working out for you?
Content audits are a perfect way to help you understand what’s working—and what you can improve—to get the results you need from your content.
Plus, it’ll only take a day or two to complete your content audit with this template.
If you’ve got a 50-page website, use this content audit template to complete the job in less than four hours. Have a 1,500-page site? Give yourself two days.
The Basic Elements of This 3-Step Content Audit Template
These are the three components of a successful content audit:
- Discover what content worked.
- Figure out a way to improve your content.
- Make a plan to optimize, create and promote your content for the next 6–12 months.
Step 1: Figure Out What Content Worked Using The Pareto Principle
Start with the 80/20 Rule. The 80/20 Rule, a.k.a. “The Pareto Principle”, suggests that 80% of your results come from 20% of your efforts.

To apply the 80/20 rule to your content audit, find which 20% of your content creates 80% of your results.
For example, if you want to generate more website traffic, then determine which 20% of your website pages generate 80% of your traffic.
If you’ve got a business goal of creating more sales, see which pages generated 80% of your income. Want more email subscribers? Determine which content drives the bulk of your subscriber growth.
This 80/20 list is almost always surprisingly short. It’s often even more heavily weighted than 80/20—more like 10% of your content assets create 90% of your results.
Find your 80/20 content data using Google Analytics.
Your content audit template begins with exporting a spreadsheet from Google Analytics.
Export the Data from Raven
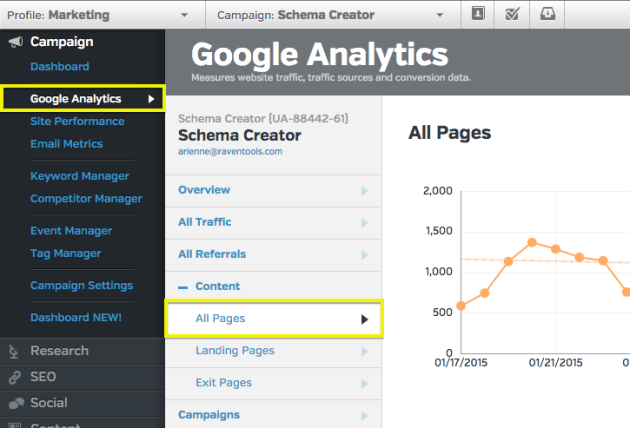
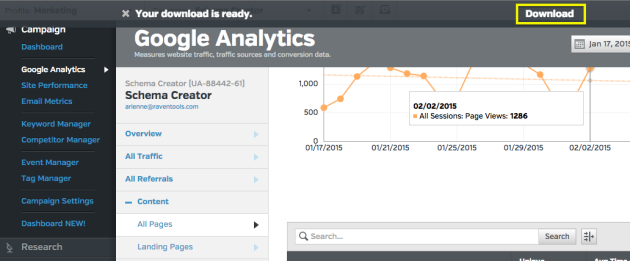
To analyze Google Analytics data in Raven, go to Go to Campaign > Google Analytics. Then follow the steps below to export a CSV of data for your content audit.
- Go to Content > All Pages after clicking Campaign > Google Analytics.
- Click the Date Picker.
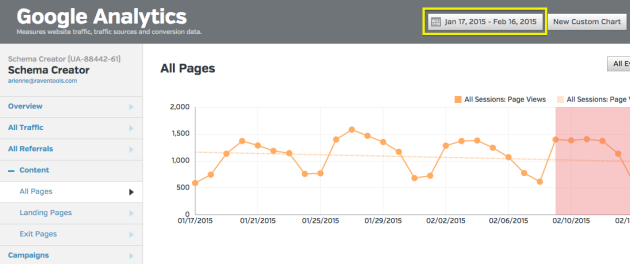
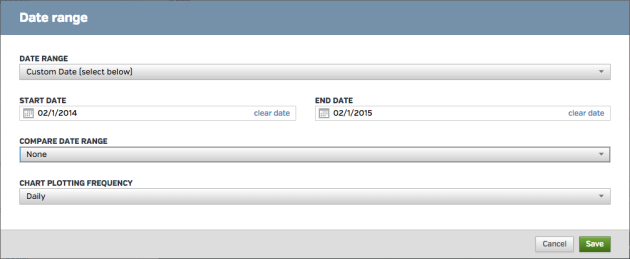
- Select a Custom Date of a year and set the Comparison Date Range to None.
- Click Table Options Icon > Save all data to CSV.
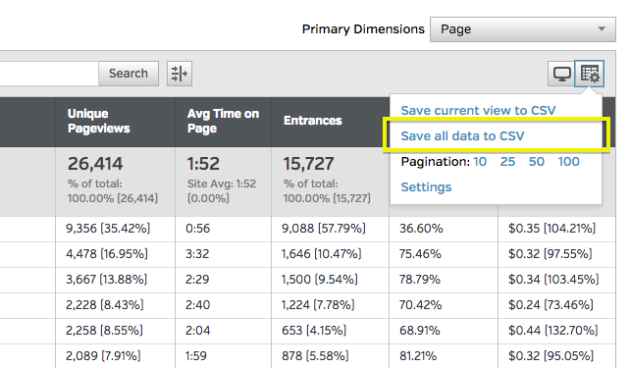
- Click the Download link when the file is ready.
Export the Data from Google Analytics
- Go to your Google Analytics account, and click on “Behavior” > “Site Content” > “All Pages”. Choose a time frame that works for you… maybe the last 12 months.

- Click the “Show rows” button at the bottom. Choose the option that lets you see all your pages.

- Click “Export” to download the report. Choose “Excel (XLSX)”.
Manipulate the Results
- See which pages create 80% of your traffic by sorting by “Pageviews” or “Unique Pageviews” (your choice).
- Go to the “Dataset1” tab on your exported report if you exported data from Google Analytics. If you exported data from Raven, you will have one sheet.
- Add two columns after Unique Pageviews. Label one column “Percentage” and the next column “Total %”.
- Create a value for the “Percentage” column by dividing the Unique Pageviews for each row by the total Pageviews.
- Then, in the “Percentage” column, include the value of the first row. To get the Total % column in the second row, add the Percentages of rows 1 and 2.
That’s a lot of steps. Here’s a visual:

It will look like this:

Now you know what your most frequented pages are. That gives you perspective on things you could possibly improve on those pages to optimize them for conversion. Now it’s time to see what your audience actually finds valuable enough to share.
There are two ways to do this. If you’re a CoSchedule user auditing your blog, just log in and look at your dashboard under “Top Posts”.

If you haven’t been using CoSchedule long, or want to measure social activity for content assets that aren’t in your blog, try SharedCount’s bulk uploader. It can give you social share counts by network in a downloadable Excel file.

Take your social shares information and append it to what Google Analytics gave you in a new column (or multiple) in your content audit template.
Step 2: Review the Top 20% of Content That Drives 80% of Your Results
Now that all the data is in one place in your content audit template, have your team do a full assessment of the top pages of your site that are delivering the most results.
Go after the big wins first.
You’ll want to start with the pages generating the most results because that’s where your content is having the biggest impact on your business goals.
Let’s assume you want to maximize website traffic. In the Excel sheet example above, half the traffic came from the top eleven pages. So if you want the most results from your efforts, focus on optimizing your most-visited pages first and work down the list.
If you can increase the results from those top pages by even 20%, it will bring more returns than if you focused on pages generating fewer results.
Here’s what to look for to enhance your content.
Now it’s time to look for patterns.

Traffic but no conversion
Which pages are getting lots of traffic, but aren’t converting?
Is there a correlation between which days you publish a blog post and how many social shares you get?
If you want to answer that question, you may need to add a column to your content audit template. Now sort your spreadsheet by top performing posts, and fill in which day of the week you published each post. If there’s a pattern, you’ll see it faster.
Content formats and subjects
What to publish (both content formats and subjects)?
Do posts about certain topics do better? Are you getting twice as many shares from, say, the videos you produce, compared to all your other content formats?
Do longer blog posts get more attention than short ones? Do the blog posts with more visuals get more traction?
Social media returns
Which social media efforts are generating the most returns? Is there a social media platform you could cut? Is there a platform you’ve tested that’s done unusually well?
Content gaps
Where are your content gaps? Do some phases of the buying cycle have no content at all, or content that doesn’t quite fit? Do any phases need more content?
Search engines
Knowing where top pages rank for primary keywords can expose big opportunities for more traffic. This is especially true the closer you get to the first position in search results.
Pages in the first position of search results get about 32% of total clicks, as opposed to those in the second and third positions. Those positions only get and 18% and 11% of total clicks.
Rankings Data in Raven
To see rankings data in Raven, open the SEO section. You can see your site’s average Google and Bing rankings after authorizing your accounts in SEO > Rankings.
In SEO > SEO Metrics > Landing Pages, browse which of your landing pages get the bulk of your organic traffic. Append this data to your Content Audit Template.
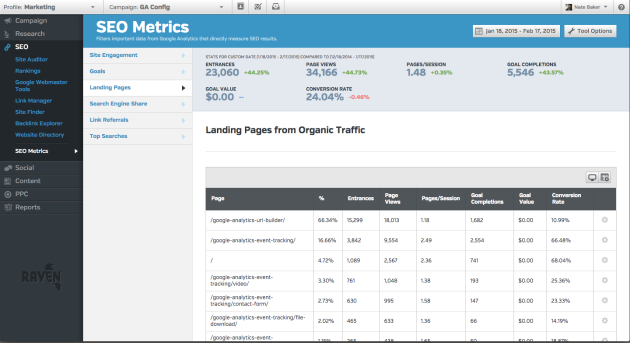
Scan landing pages for opportunities. Identify which of your pages receives some traffic but could be getting a lot more.
Rankings Data in Google Webmaster Tools
To see your site’s ranking data, head over to your Google Webmaster account.
Look in “Search Traffic” > “Search Queries” to see where your top pages rank. Then append this data to your content audit template.

Analyze Rankings Data
Use this appended data to see how much of a reward you’ll get for moving each page up in the SERPs, if only by a nudge. So look for positions 2 through 4, or positions 10 through 14.
If you can increase a page’s ranking from position 4 to position 2, you could double your traffic. Getting a page up from the second page of SERPS to the first one can also double traffic.
Finally: Document what needs to be done to optimize your content.
As you analyze all this data, add columns to your content audit template for comments about what needs to be fixed on each page. This can be useful for assessing how much work needs to be done—and who will do it.
For example, your columns could include “Leave as is”, “Update links”, “Bad bounce rate”, “Needs rewrite”, “Needs redesign”, “Title/Meta tags”, or “Call to action”.
As you find content gaps, add rows in your content audit template for the content you’ll create.
If you wanted to go further and quantify the work, you could add another column estimating how much time it will take to fix each page.
Add one last column in your content audit template to assign each task to a specific person and suddenly you’ve got an actionable plan.
Step 3: Create a Plan for Content Creation, Promotion and Optimization for the Next 6–12 Months
Now you have to figure out how to apply everything you’ve discovered. The odds are extremely high that by now you’ll have had several major realizations about what to do.
Focus. Make a list of your top 5–10 takeaways from your content audit.
Then lay out a simple plan for how to apply what you’ve learned, both in terms of new content to create, and old content to optimize or update. Focus on which takeaways will deliver the most results for your business.
Break out the editorial calendar. It’s the best way to put a reality check on how much you can actually do. It’s also the best way for everyone on your team to understand his or her role in the coming weeks.
So that’s the complete process of running a content audit, from business goals to having a well-planned editorial calendar.
How could you use a content audit to get better results from your content?

Analyze over 20 different technical SEO issues and create to-do lists for your team while sending error reports to your client.