


It’s live!
No more waiting for Raven to update our Google Analytics reports with the data you want most. Based on customer feedback, we reorganized and added more than a dozen new metrics and views to make your reports really sing.
Two key new menus make it much easier to find the data you need:
- Table Content chooser (a.k.a Explorer)
- Primary Dimension chooser
When you combine these new menus with the new metric views and other filters, you can now access virtually all the data you need for client reporting.
Log in to your Raven account now and check out the improvements.
I do recommend that you sign up for a free, 30-minute training class about the new Google Analytics integration in Raven. I’m teaching two — one on Thursday and one on Friday. If you can’t make a live training session, register anyway. We’ll send you a recording.
In the meantime, here are three ideas for Google Analytics reports that you can now create in Raven:
3 Reports You Can Create Now
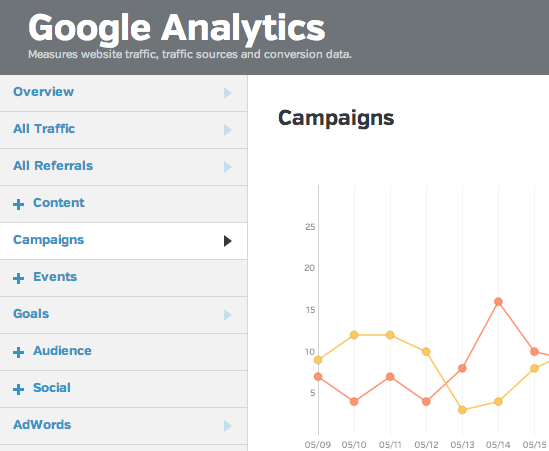
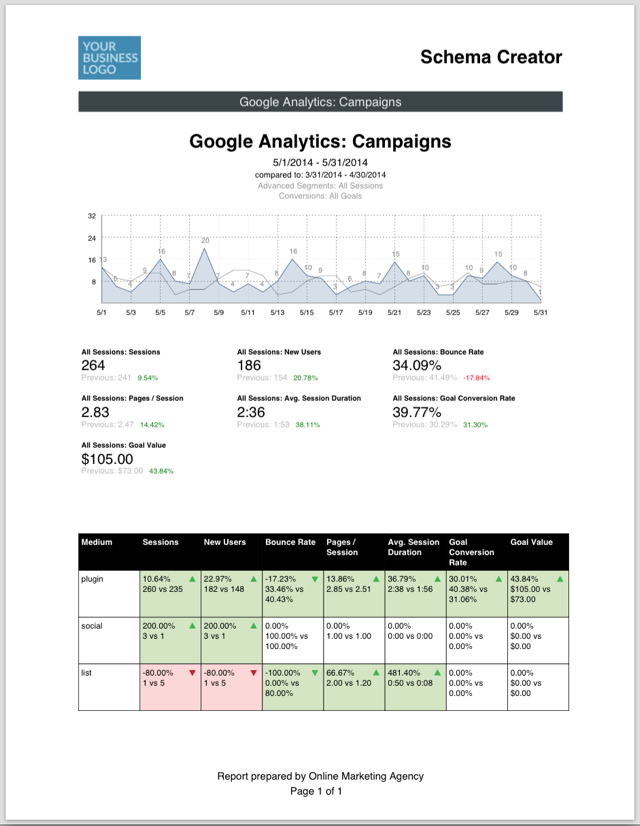
1. Display and report on Campaigns
One of the most common marketing techniques is to use Campaign Variables with URLs – usually with a URL shortener. They’re a great way to track the effectiveness of sharing links socially or using them in print advertising, associated with goals. Raven now provides quick access to all of your campaigns.
1. Go to Campaigns in the new sidenav.
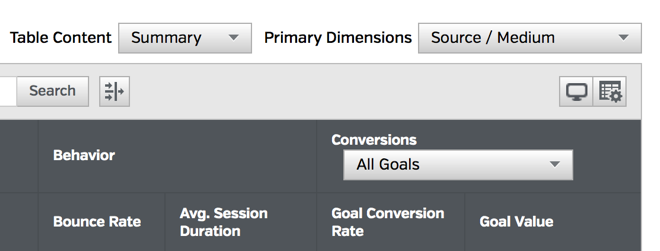
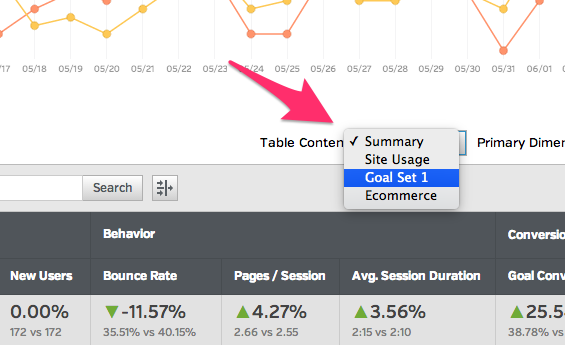
If you want to display a specific goal, select it from the Conversions header. Alternatively, you can use the new Table Content option and select a Goal Set.
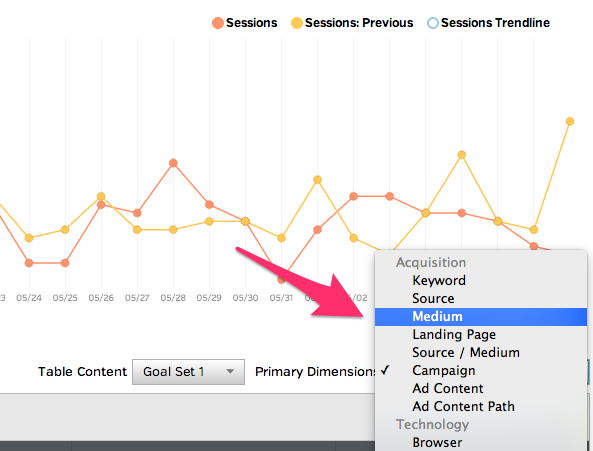
2. Use the Search input field to quickly filter and find the campaign(s) you’re looking for. Alternatively or in addition, you can also use the Primary Dimensions chooser to select a different dimension, like Source, Medium or Keyword.
3. From the Tool Options you can choose Create PDF Report to make a PDF from the current view. This view can also be reported using our reporting software.
2. Display and report on goal completions for Mobile Devices
Now that mobile traffic is starting to overtake desktop traffic – especially from search –many marketers are focused on improving the mobile user experience for their sites. A common marketing goal is keeping users on their site and having them view more than one page. With the new Mobile Device view, marketers can now view and report on that type of goal.
1. Go to Audience > Mobile Devices and select the Goal from the Conversions header.
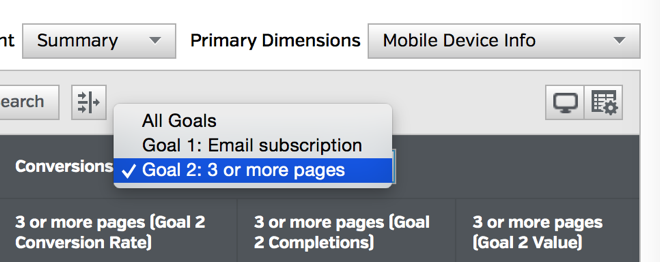
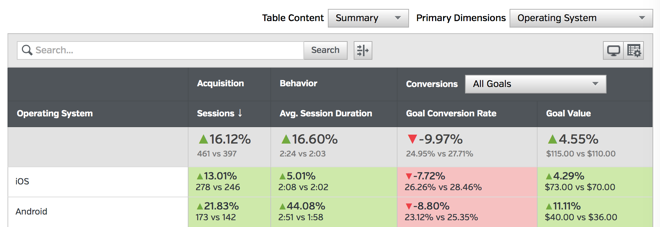
2. If you want to report goal performance based on the operating system, instead of the actual device, change the Primary Dimension to Operating System.
3. Use the Tool Options or Report Wizard to create a PDF report.
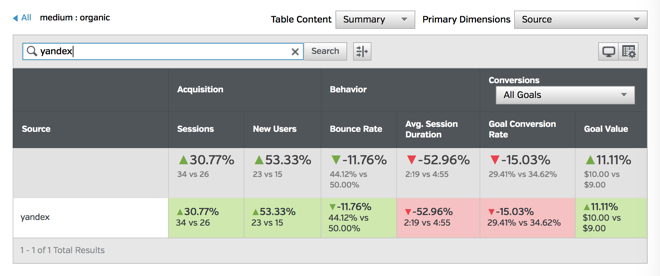
3. Digging Deeper: Display and report on organic metrics from yandex.ru
1. Go to the All Traffic view and change the Primary Dimension to Medium. Then click on organic.
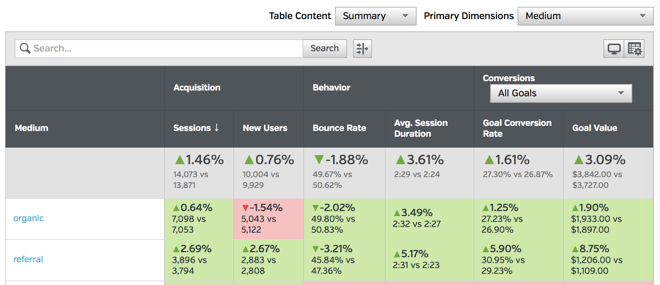
2. Change the Primary Dimension to Source and then filter (search) with yandex. You now have all of the Acquisition, Behavior and Conversion metrics for non-paid traffic from Yandex.
3. Use the Tool Options to create PDF report.
Those were just three out of the seemingly unlimited number of metric views and reports you can now make in Raven.
How will the new Google Analytics reporting make your job easier? Did your feature request make the cut?
Learn About Our SERP Rank Tracker
We wanted to provide the most flexible rank checking to our users, so we let you control how frequently we check the SERPs for changes to your ranking.
Thanks Jon and all the Ravens that put time into this update, I’m off to run some reports!
I wish the charts matched the data being represented in the table – similar to how Google Analytics works now. For example, if I select a specific referral site, I would like the chart to show data just from that source (Google analytics does this).
However, even without that feature, this is a kick-ass upgrade. All of the important info is laid out in an easy to follow format – with the important stuff being the easiest to find and track. Great work simplifying the mess known as Google Analytics.
Agreed. Also for the webmaster tools reports.
We’re actually working on that right now 🙂
I agree, it is not good to have wrong charts in clients’ reports…
It’s obvious that my client call me and ask “Hey why did you wrote a number and in the chart I view a different number?”
Thank you, now to run some new reports just in time for meeting new customers.
Good. But question is: Why I should use Raven Tools instead of Google Aalytics?
I think this will answer your question 🙂 http://www.slideshare.net/raventools/simple-googleanalyticsreportsraven2014
Raven is perfect tool except the fact that it is still missing a real SERP checker. I would love to hear from you guys on this. I won’t mind paying more for the service if added. It is really sad and frustrating!
I agree with you 100% Ayman. I love RavenTools and used it for years. But I really needed a better SERP checker, one that could check local versus national… moved to WebCEO for now and am happy.
I feel your frustration. I wish we could have it too. The problem is that the only way we can ensure direct access to Google’s APIs now and in the future, both for tools and reporting, is to remain compliant with their terms of service. Any other software service that is both using their APIs and incorporating data that breaches their ToS risks losing that data completely at anytime. We want to be around for a long time, and it’s not a risk we’re willing to take.
What about advanced filtres? If I want to report my customers the list with all pages of my website with their visits number and bounce rate or conversion rate, now I can do, but if I want to show the same report, just for pages with more than 50 visits I need an advanced filter like in Google Analytics. Isn’t there a way to build such a report?
That’s an excellent question. It’s the first time I’ve seen that particular request, and it’s currently not available, but that would be great to have. I’ll definitely add it to our list of enhancement to look into adding.
Yes because it’s very different if a bounce rate of 80% is associated to pages with 3 or 4 visits than if it is associated to pages with 40 or 50 visits, so I always prefer to use advanced filters. Thanks.
The improvements are great, but I think that I see a continued flaw: There’s no option for calendar month to calendar month comparison. One of the above screen shots (Google Analytics: Campaigns) shows May (5/1 – 5/31) compared to the prior 31 days (3/31 – 4/30). Will I ever have the option to compare calendar month to calendar month even if they don’t have the same # of days??
We support the same thing that GA does. Just like GA, you can select a custom date range to compare with. We’ll definitely consider adding a previous month option though. Thanks for the suggestion.
Sorry, I should have been clearer. When creating a Google Analytics report inside the Report Wizard, you can’t set either a custom date range or “last month” for comparison.
Hey have you managed to find a fix for this problem as yet?