When Raven first integrated Google Analytics (GA) data several years ago, we solved three problems online marketers had with GA.
- Marketers couldn’t find their way around a complex GA navigation. Raven created a simpler navigation.
- Marketers couldn’t find or create the metric views they wanted in GA. Raven integrated only those metric views — no confusing noise.
- Marketers couldn’t automate or brand GA reports. With Raven, they could.
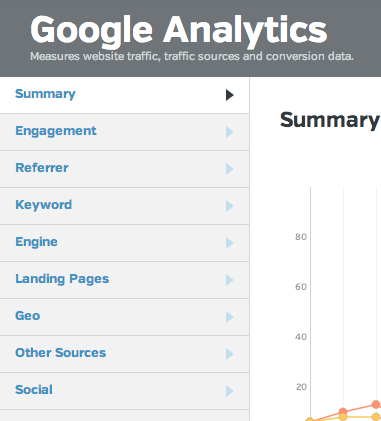
This is what we’ve been using for our Google Analytics integration for several years now.
Our simplified navigation and metric views served our marketing customers well. However, a lot has changed with Google Analytics since then — some good, some bad.
What’s good: Over the past couple of years, Google has aggressively added new types of metric views. More recently, they’ve introduced (and in some cases replaced) common nomenclature. For example, they introduced new metric groupings named Acquisition, Behavior and Conversion. They also renamed Visits to Sessions and Visitors to Users.
What’s bad: The navigation is more frustrating than ever. Once again, the GA navigation has made it difficult for marketers to quickly find the metric views they need most. Marketers now have to hunt for metric views that are hidden inside of the new groupings.
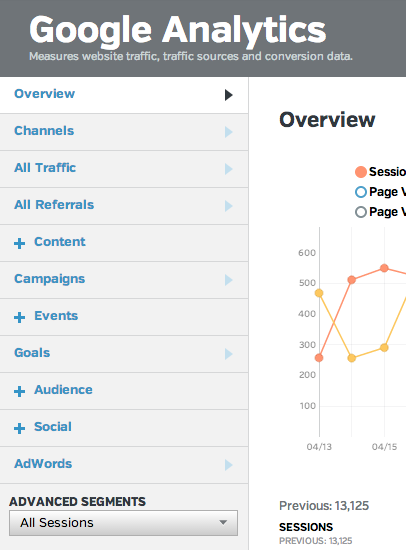
To help you fully understand just how daunting the GA navigation is, here it is with every option open:
Are you still with me? Good!
New Google Analytics Integration Features
Over the past few months, we have asked questions. We surveyed our customers. We reviewed our feature requests. We took all of that feedback and figured out what to do.
Raven will release significant updates to our Google Analytics integration in early June.
Raven’s updates once again solve the same three problems for marketers. Raven customers can expect:
- Simpler navigation
- Faster access to key marketing metrics
- Brandable, automated reports
Here’s a preview:
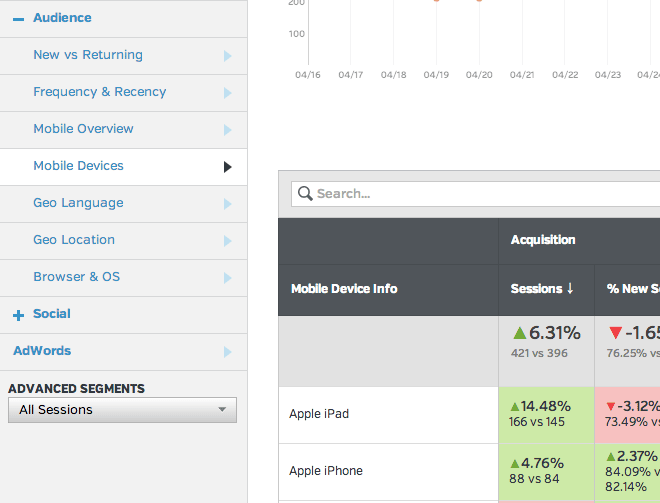
Raven narrows things down to the metric views that are most important to busy marketers. The new navigation will provide visibility and quick access to those metrics.
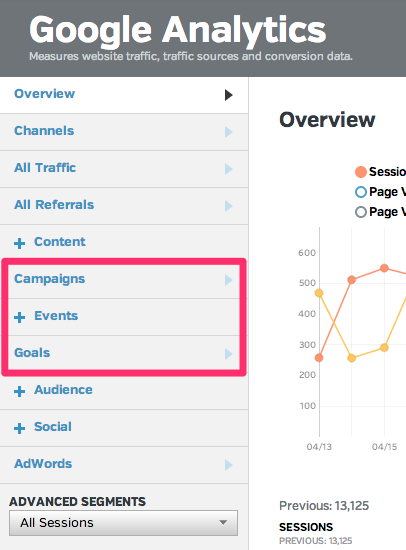
Quick Access to Campaign Performance Metrics
Raven customers will have quick access to performance metrics related to Campaign Variables, Event Tracking and GA Goals.
New Audience Metrics
We added the most requested Audience metrics, including New vs. Returning, Frequency & Recency, Mobile Overview, Mobile Devices, Geo Language and Browser & OS.
New Table Metrics
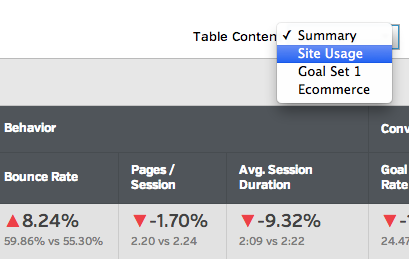
The table data will reflect the new GA nomenclature and data. For example, the Table Content Summary view now displays the data column groups Acquisition, Behavior and Conversions and their relevant data.
New Table Header Summaries
Just like GA, Raven will display the column summaries in the header of the table.
New Table Content (a.k.a. Explorer) Option
All of Raven’s GA views will support Table Content options, which include Summary, Site Usage, Goal Sets and Ecommerce.
New Primary Dimensions Option
All of the views will be able to have their Primary Dimension changed by dimensions that are relevant to the current view. For example, you will be able to change the default Primary Dimension for a Campaign from Campaign Name to Medium.
New Comparative Date Ranges in the Tables
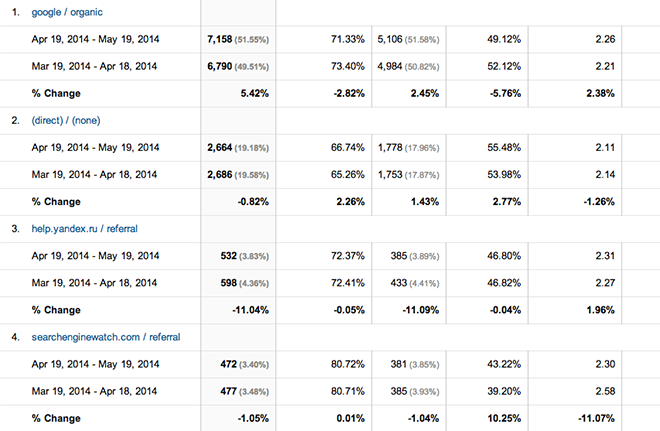
One of the features that I’m the most excited about is how you will be able to visualize metric changes over time in the table. In Google Analytics, they stack dates and numbers on top of each other for each row, and it’s a lot of data to take in.
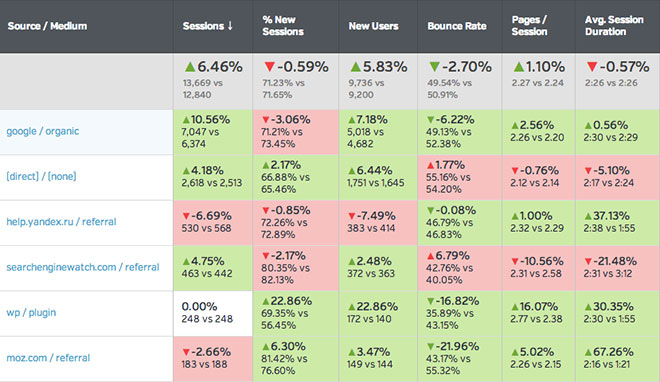
We chose to borrow from our Keyword Rankings Tool to use a more visual approach to communicating change. When you view comparative data in Raven, the table cells will combine the comparative data with arrows and color coding to draw attention to positive and negative changes.
The same information takes up less space and gets the point across much faster.
Reports
Finally, as always, everything is reportable. You can brand, schedule and automate reports to be delivered internally or to your clients.
Speaking of Raven reports… stay tuned 😉
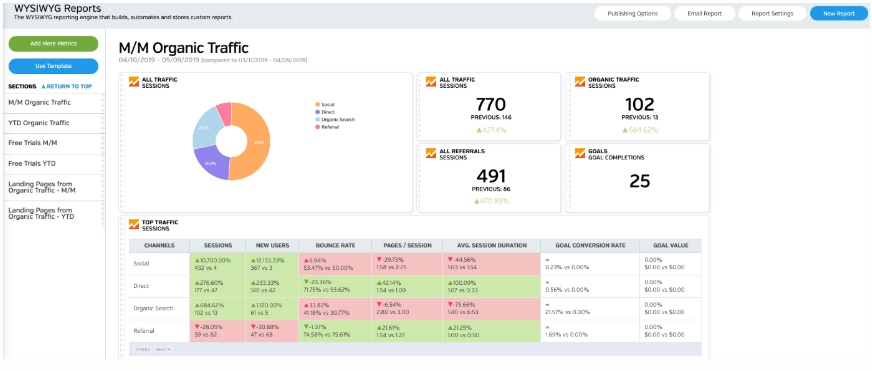
White Labeled and Branded Reports. Drag and Drop Editor. Automate your SEO, PPC, Social, Email, and Call Tracking Reporting.






Seems legit!
Totally legit! http://www.buzzfeed.com/jessicamisener/27-things-that-are-totally-and-100-legit
That’s exciting! I am looking forward to checking out the new stuff and adding them to my reports.
Congrats, can’t wait to check it out!
I can appreciate the massive effort that’s been undertaken to condense, massage and realign the data. No small feat by any means. As a user, my first thought is that I’m going to eventually settle into 2 or 3 “views” that are going to be my quick go-tos. I’m hoping there’s some ability to save or have some stickiness to the last view/chart.
Joe, we appreciate the appreciation 🙂 No, not a small feat, but we have a crack team of developers and one determined Jon Henshaw.
I’ll check about the stickiness for last views and charts. One thing I do with Raven often is open certain views in new tabs in my browser. Then I can move on to other things and just refresh as needed.
If there are some metrics or views you plan on viewing often, we may end up solving that problem in a few months when we launch our new Dashboard. You’ll be able to pick and filter that data, and then permanently display it on the main Dashboard. Stay tuned!
This is very good news. Thank you for the ongoing improvements to keep the platform relevant!
cool! when does this come out ?
In about 2-3 weeks. Very soon! 🙂
Can’t wait for it to take flight!
Really looking forward to this, but please, please bring back transactional reporting, i really miss that feature in your current set up.