You work hard to produce great content, but does your content work hard for your business in return? The only way to know for sure is to track the relevant metrics. By focusing on the numbers, you’ll get a good idea where your content shines and where you might need to tweak your strategy for better returns.
List Of Content Related Digital Marketing Metrics
- Website Metrics
- Traffic
- New vs. returning visitors
- Time on page
- Pages per session
- Bounce rate
- Social Metrics
- Followers
- Shares
- Comments
- Conversion Metrics
- Leads generated
- Conversion rate
- Cost per lead
- Return on investment
- Lead to Sale Rate
On-Site Metrics
- Traffic
How many visitors are looking at the content on your site? High viewership indicates both that people are able to find your content and that it’s useful to them. In addition to total traffic, pay attention to your most and least viewed pages. Try to figure out what differentiates your most successful pieces of content from the rest. Then see if you can recreate that success by publishing similar content on related topics.
- New vs. returning visitors
Your site traffic doesn’t tell the whole story when it comes to your audience. Notice how many of your visitors are new and how many have been on your site before. A high proportion of returning visitors usually means that your content has made an impact on viewers, and they’re coming back for more.
- Time on page
You can see how engaged viewers are with various pieces of content by looking at how long they spend on each page. Usually, the longer your visitors stay, the more thoroughly they’re consuming (and remembering) your content.
- Pages per session
Do visitors look at just one page on your site before leaving, or do they tend to bounce around and view multiple pieces of content? A high pages per session rate indicates that your content is interesting enough to draw people in. It also means you’re doing a good job with your internal linking strategy.
- Bounce rate
Your bounce rate is the percentage of visitors who click away from your site after viewing a single page. Some bounces are inevitable, but if you have a high bounce rate (over 70%), it may mean that your content isn’t grabbing visitors effectively enough. Be careful though using this metric on it’s own. Often the type of content you’re creating is going to naturally have a higher bounce rate. Best practice is to only measure this metric for changes you’ve made to this specific page/post to see if you’ve made the content more sticky or done a better job at driving people deeper into your site.
Tracking Site Metrics with Google Analytics
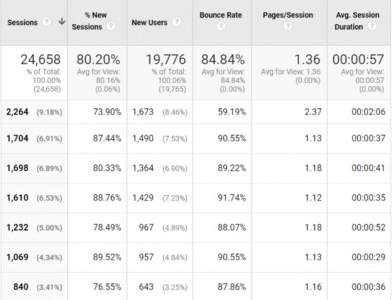
Google Analytics is the standard tool for tracking on-site metrics like the ones listed above. It’s free, and you don’t need to be a tech wizard to set it up and learn the ropes. However, if you are technically inclined, GA has plenty of advanced features to play with.
Google Analytics tracks all your most important site metrics for you. Source
Looking to branch out from Google Analytics? A few other good options include Kissmetrics, SE Ranking, and Matomo. Matomo is free and open-source, while the other two options are paid.
[If you’re looking for an automated report option to show Google Analytics data alongside Search Console data and SERP rankings, then check out Raven’s reporting tools.]
Social metrics
- Followers
Your business’ social media follower count can be indicative of a couple of things: how easily people are finding your content, and whether they like it enough to want to see more. Having a lot of followers isn’t everything — quality is just as important as quantity here — but it’s an important number to watch nonetheless. Make sure to track your audience’s rate of growth in addition to your total follower count.
- Shares
It’s one thing for people to look at your content themselves, but an even better test of quality is whether they want to share it with their colleagues and friends. If your content gets shared frequently on social media, you’re doing something right.
- Comments
Another foolproof way to quality-check your social media content is to monitor the level of engagement it produces. Do people comment on your content frequently? Does your content spark conversations among your audience? Comment-worthy posts are likely to drive other, more important actions, such as site visits and conversions.
Tracking Social Media Metrics with Buzzsumo
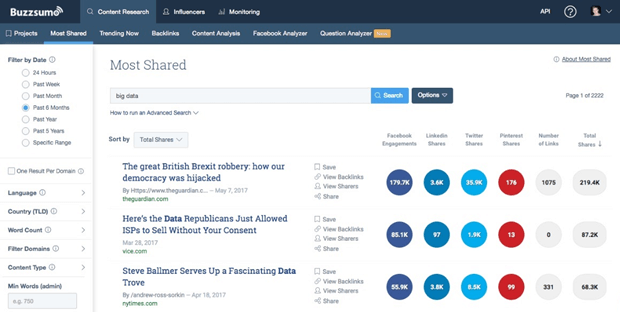
Gathering social media data by hand isn’t practical. Luckily, there are plenty of apps that will do it for you. Buzzsumo is one of the most popular options. It aggregates all your data from multiple social platforms into one dashboard for at-a-glance analysis.

Buzzsumo metrics
Buzzsumo pulls all your social media metrics into one place. Source
Conversion metrics
- Leads generated
It’s great to get lots of views and engagement when you post a new piece of content, but the real test of your content’s effectiveness is whether it gets you new leads (and eventually more sales). Because of this, it’s important to keep track of how many leads your content generates for your business. It’s also important to know what your Lead to sale rate is so you know how many leads actually convert to paying customers. This often gets forgotten when just looking at Analytics because sales teams often use different CRMs or processes than their marketing/website team.
- Conversion rate
How many of the people who discover your business through your content end up making a purchase? Once you start tracking the leads you get from your content, you’ll be able to figure out this percentage. The more effectively your content pulls in qualified leads, the higher your conversion rate will be.
- Cost per lead and return on investment
Leads aren’t free, and it’s important to be aware of how much your business is spending to reach new prospects. Divide the amount of money you spent on your content in a given timeframe by the number of new leads you got in that timeframe, and you have your cost per lead. Then consider how much of a return your business made on that investment. Your ROI is a simple and accurate indicator of how much your content is actually helping your business.
Tracking Conversion Metrics with Google Analytics Goals
To monitor your conversion metrics, you’ll need to set up goals in Google Analytics. To do so, scroll down the Analytics sidebar to Conversions, click Goals, and select Overview. GA will prompt you to enable goals if you haven’t already. You can define anything you want as a goal — a few examples might include filling out a form, downloading a PDF, or making a purchase. Create up to 20 goals per reporting view.

Google Analytics Goals
Once you set up goals, Google Analytics shows you a funnel view of how many people convert. Source
The Takeaway
It’s difficult for most business owners to answer the nebulous question, “Is my content working?”. A simpler, more concrete approach is to identify and track a handful of important metrics that will answer that question for you. Start monitoring these 11 key metrics now, and you’ll get deeper insights into how effectively your content is reaching new people, engaging your current leads, and turning prospects into customers.
Are there any additional metrics you would add to this list? Share your thoughts in the comments section below!

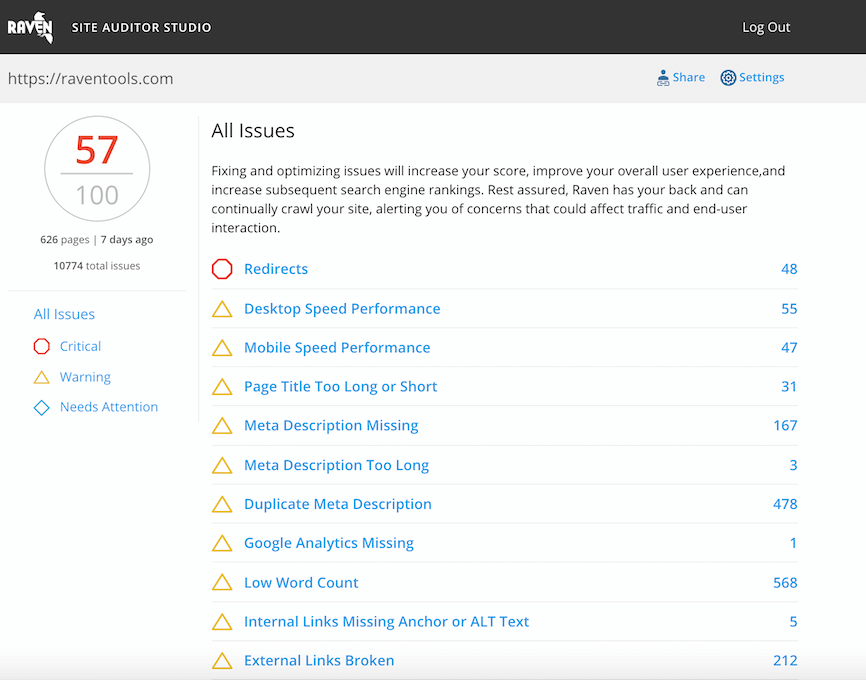
Analyze over 20 different technical SEO issues and create to-do lists for your team while sending error reports to your client.


